ernanhughes
Maximizing Margin for SVMs
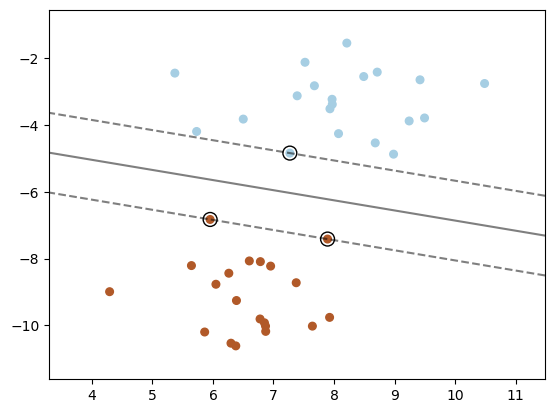
The margin is defined as the distance between the closest data points of each class to the hyperplane. These closest points are known as the support vectors. The SVM aims to maximize this margin to improve the model’s generalization ability.
import matplotlib.pyplot as plt
from sklearn import svm
from sklearn.datasets import make_blobs
from sklearn.inspection import DecisionBoundaryDisplay


# we create 40 separable points
X, y = make_blobs(n_samples=40, centers=2, random_state=6)

# fit the model, don't regularize for illustration purposes
clf = svm.SVC(kernel="linear", C=1000)
clf.fit(X, y)

plt.scatter(X[:, 0], X[:, 1], c=y, s=30, cmap=plt.cm.Paired)

# plot the decision function
ax = plt.gca()
DecisionBoundaryDisplay.from_estimator(
    clf,
    X,
    plot_method="contour",
    colors="k",
    levels=[-1, 0, 1],
    alpha=0.5,
    linestyles=["--", "-", "--"],
    ax=ax,
)
# plot support vectors
ax.scatter(
    clf.support_vectors_[:, 0],
    clf.support_vectors_[:, 1],
    s=100,
    linewidth=1,
    facecolors="none",
    edgecolors="k",
)
plt.show()